Dashboard Overview
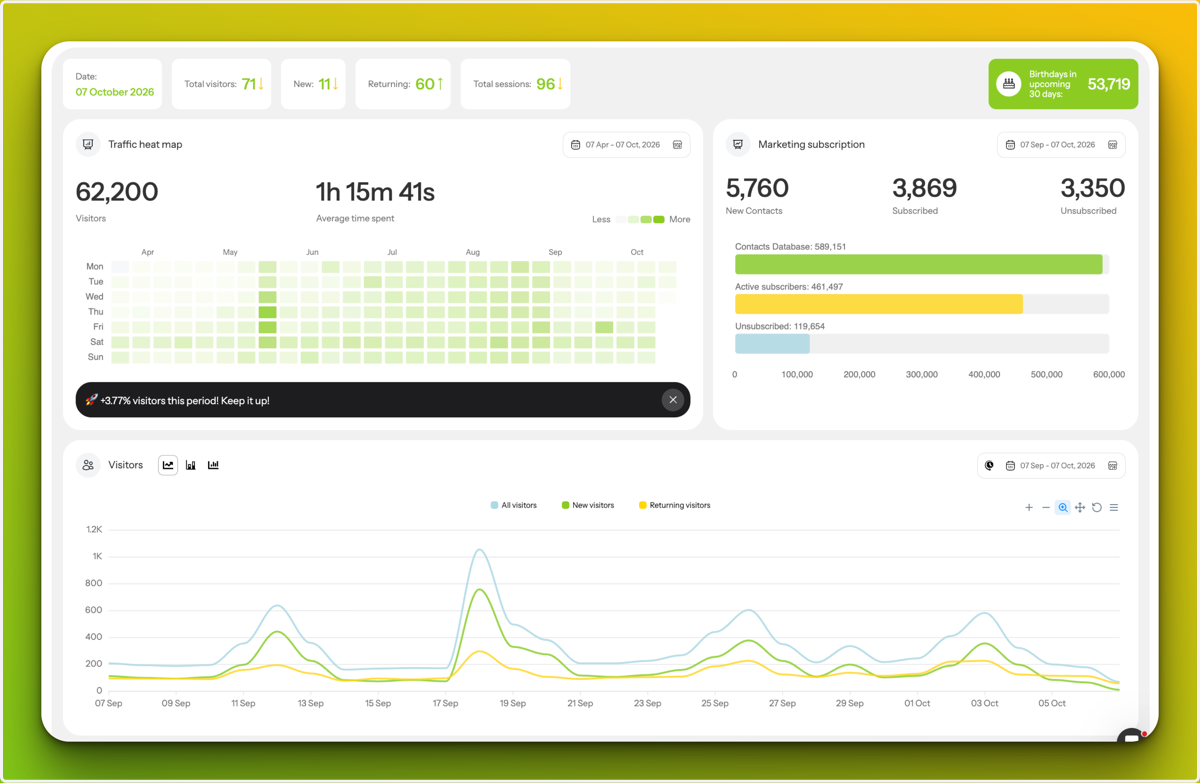
The Affinect Dashboard shows your key business analytics in one place, helping you understand visitor activity, customer behaviour and marketing performance.
Use the calendar and venue selectors on each analytic to choose the time period and location you want to review. You can select one or multiple venues at the same time to view their combined analytics.
Each analytic has its own filters, so changing the date range or venue selection for one analytic will not automatically change the others.
These analytics can then be used to support campaigns, coupons, loyalty programs and customer engagement.
Key Dashboard Metrics
The top of the Dashboard gives you a quick view of visitor activity.
- Total Visitors: Individual visitors recorded.
- New Visitors: Customers visiting for the first time.
- Returning Visitors: Customers who have visited before.
- Total Sessions: Connection sessions created by visitors. One visitor can create multiple sessions during the same visit, for example after disconnecting and reconnecting.
- Yellow Arrows: Compare the current figure with the daily average from the previous 7 days. Up means above average; down means below.
- Upcoming Birthdays: Customers with a birthday in the next 30 days, useful for personalised campaigns, rewards or coupons.

Traffic Heat Map
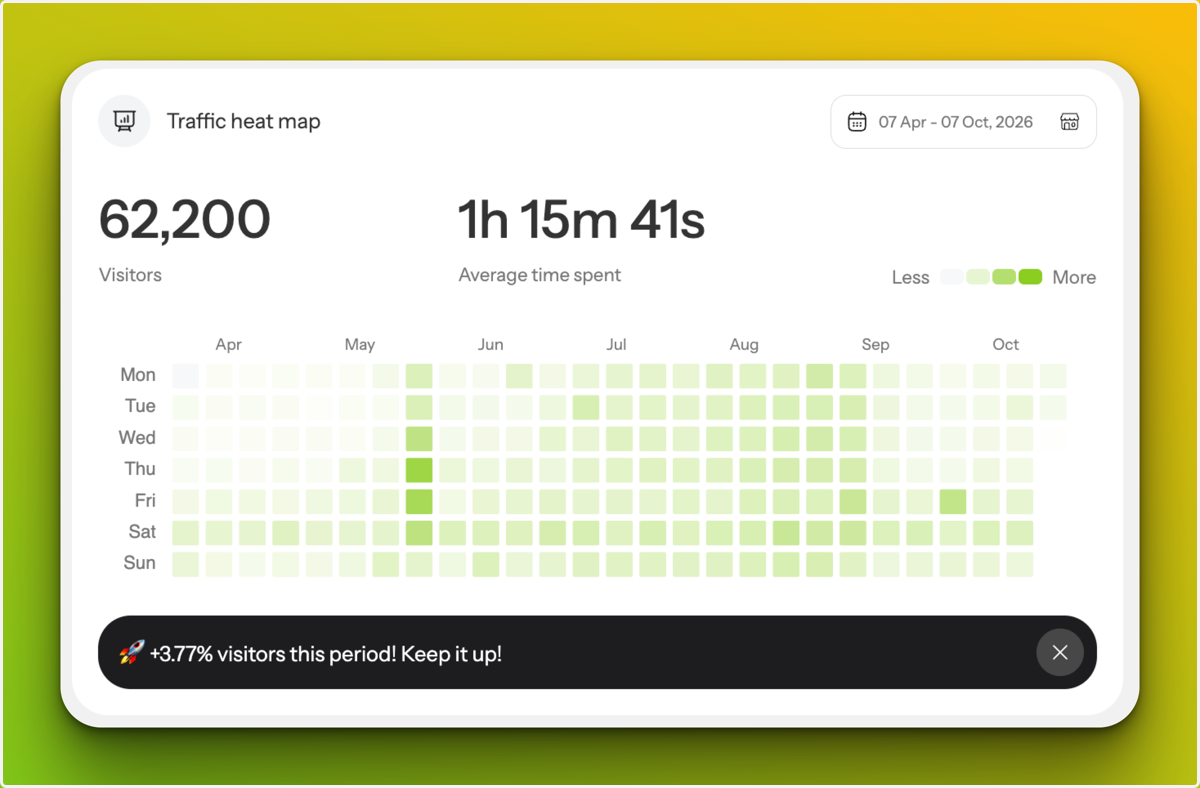
The Traffic Heat Map shows visitor activity recorded through connections to the venue's Wi-Fi.
- Darker green indicates higher visitor activity; lighter green indicates lower activity.
- Average Time Spent shows how long visitors typically spend at the venue.
- The reporting period and venue can be adjusted from the toggle at the top right corner as required to review the analytics for a specific timeframe or location.
For more detailed guidance, see **_Using the Traffic Heat Map in Affinect_.**
Marketing Subscription
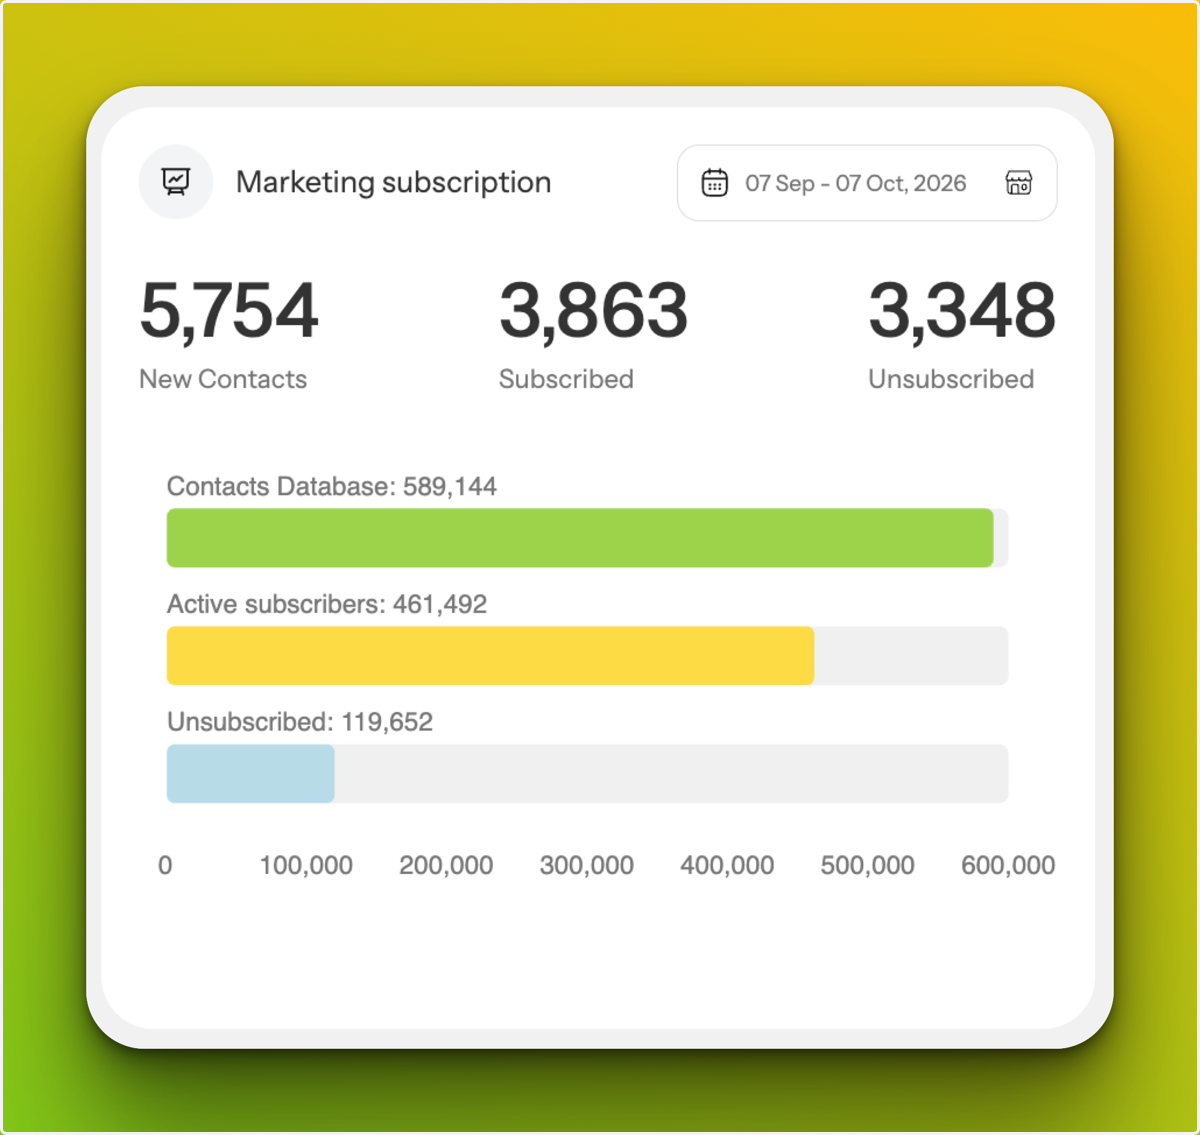
The Marketing Subscription analytics show how new contact profiles relate to marketing consent.
- New Contacts: New contact profiles created.
- Subscribed: Contact profiles that consented to marketing communications.
- Unsubscribed: Contact profiles that did not opt in.
- Contacts Database: All contact profiles in the database.
- Active Subscribers: Partially subscribed, fully subscribed and resubscribed contact profiles.
- Unsubscribed: Total unsubscribed contact profiles in the database.
Visitors
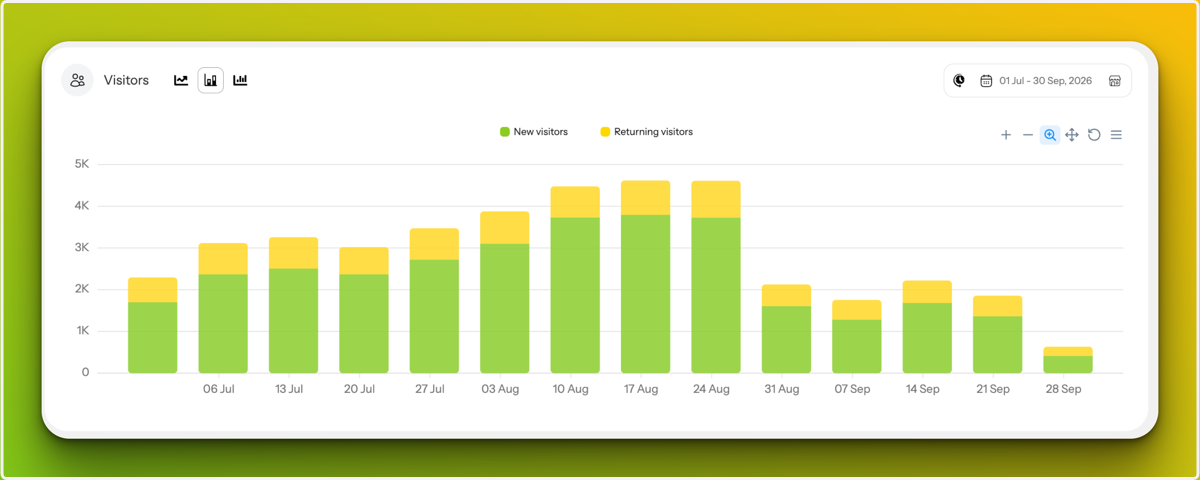
The Visitors analytics show changes in visitor activity over time, including new and returning visitors.
Use the calendar and venue selectors to choose the period and one or multiple venues you want to review. This makes it easy to compare visitor trends across the selected timeframe and locations.
Trinkgeld: Compare periods before and after a campaign, coupon or promotion to help evaluate its impact on visitor activity.
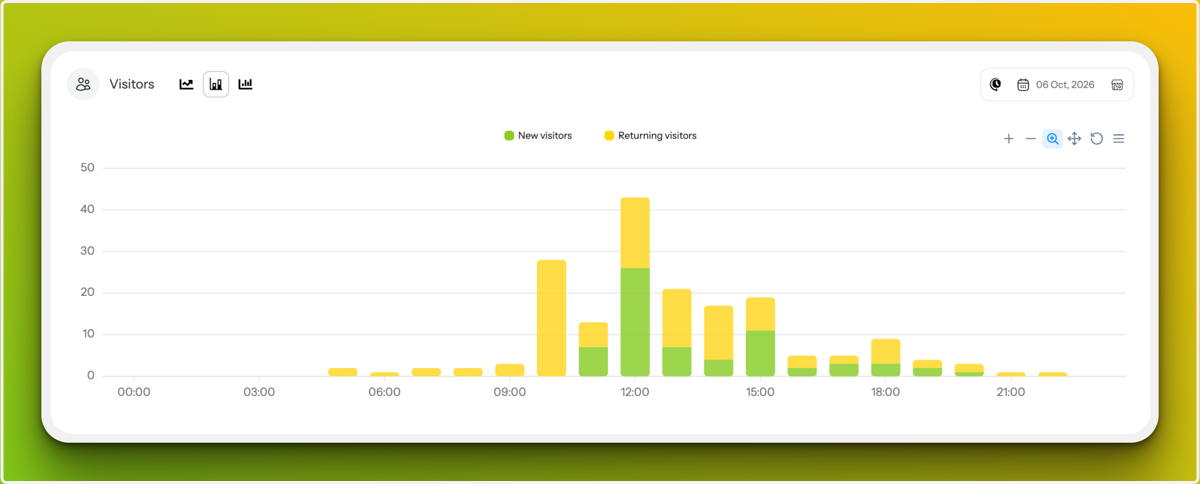
Hourly View
When a single day is selected, the Visitors analytics can be viewed by Hourly activity for a more detailed look at that day.
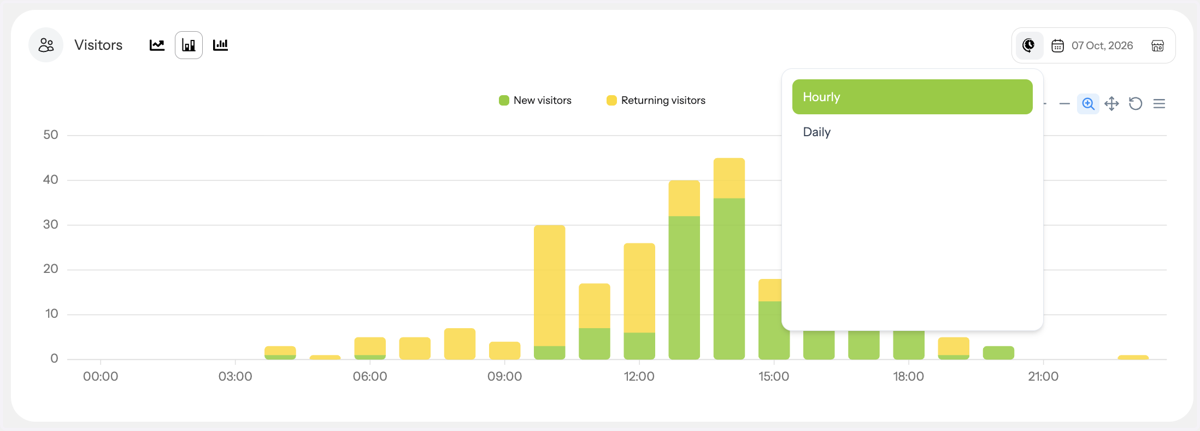
Daily View
When a single month is selected, the Daily view allows visitor activity to be reviewed day by day across that month.
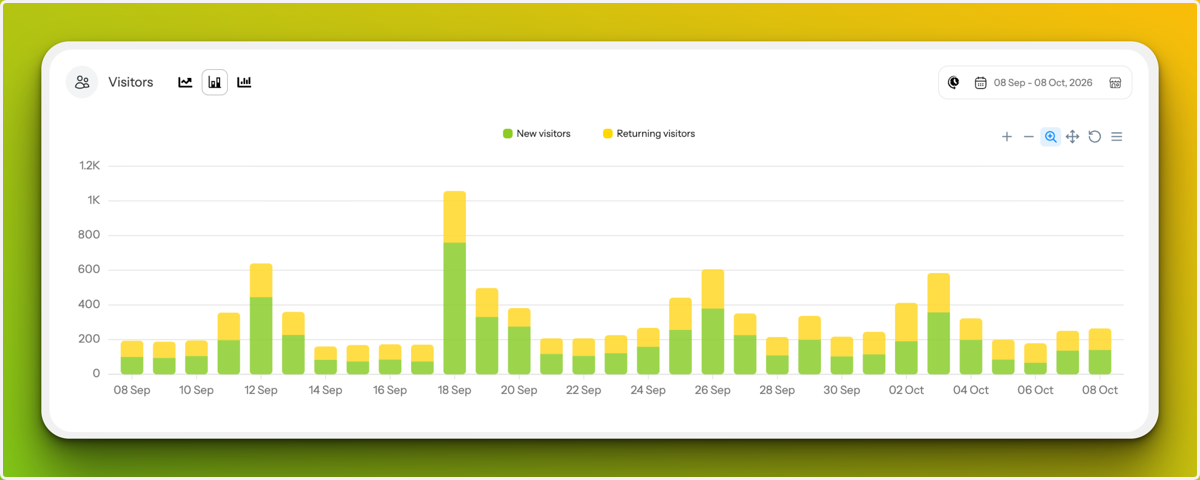
Weekly View
The Weekly view becomes available when at least one month is selected, allowing visitor activity to be reviewed and compared week by week.
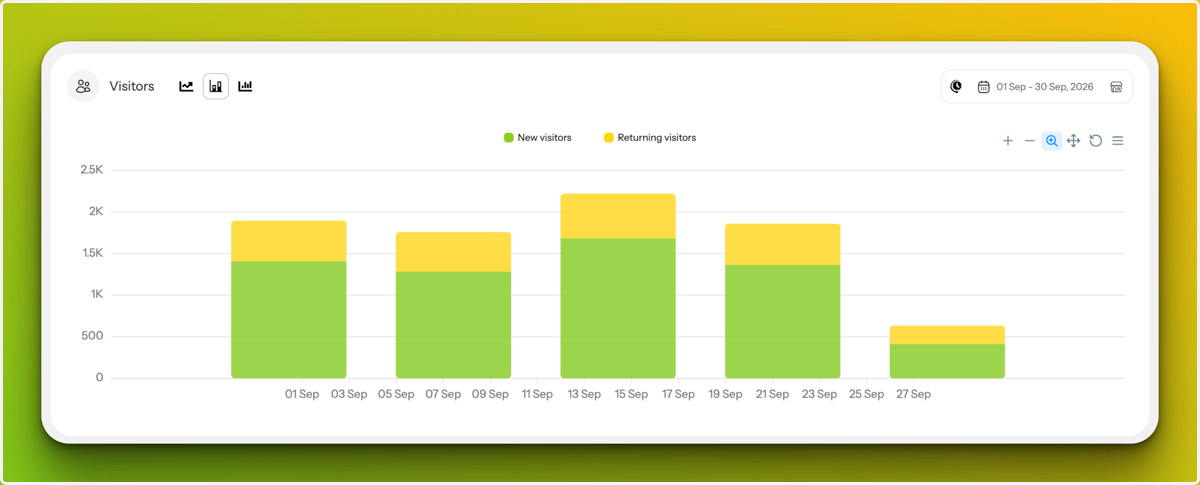
Multiple-Month View
When multiple months are selected, the Monthly view becomes available, allowing visitor activity to be reviewed as a broader month-to-month trend.
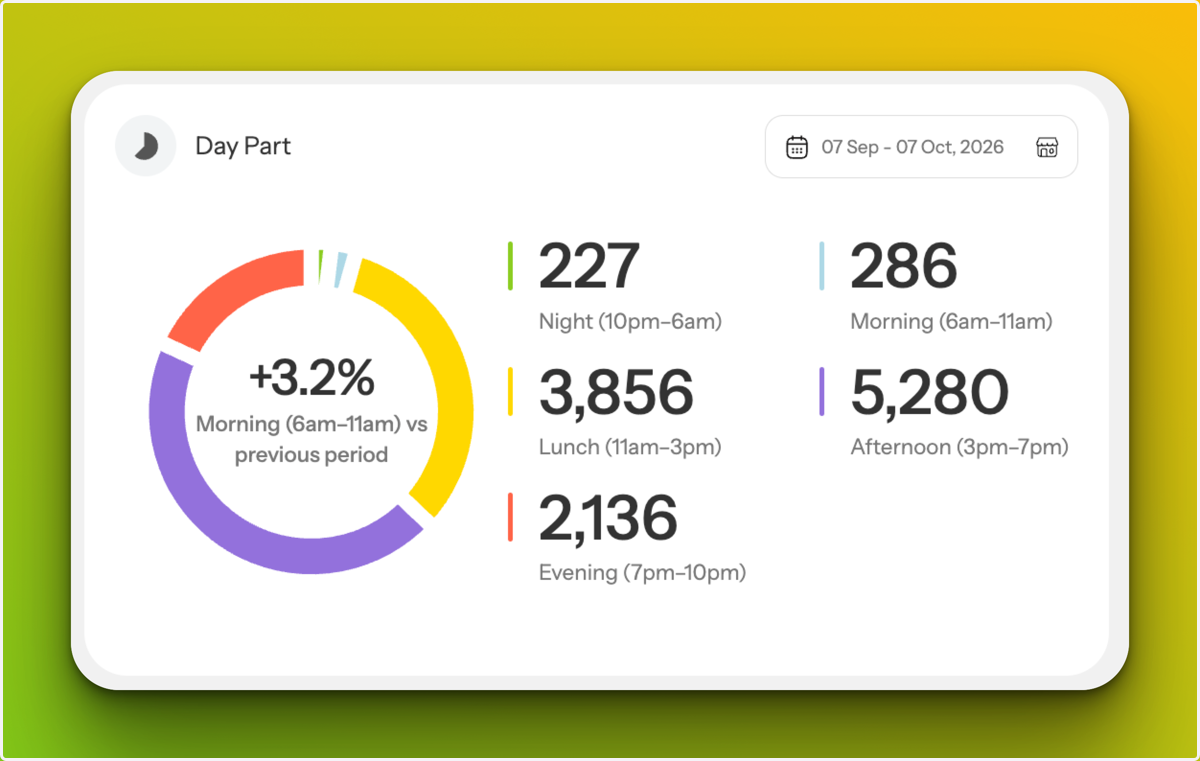
Day Part
The Day Part analytics show when customer activity is highest or lowest throughout the day.
Trinkgeld: Quieter periods may provide opportunities for time-specific campaigns or coupons designed to encourage additional visits.
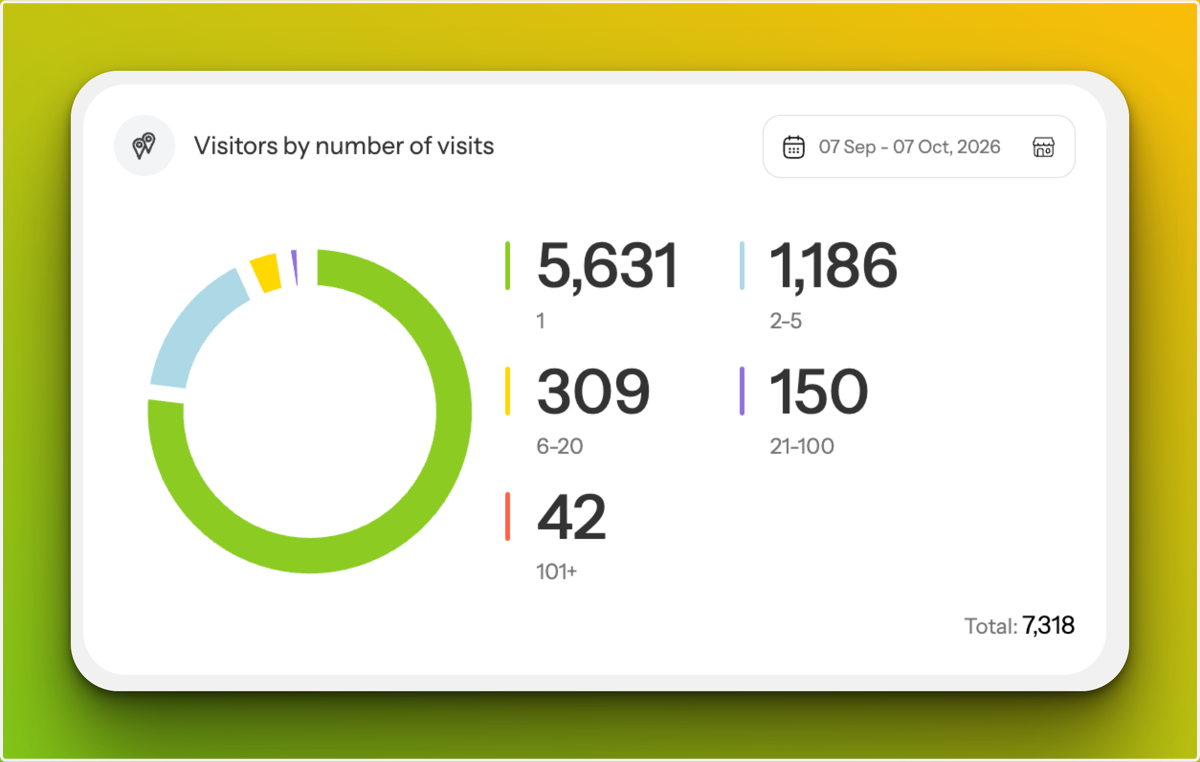
Visitors by Number of Visits
The Visitors by Number of Visits analytics show how often customers in your contact profile database have visited.
It compares customers with only one recorded visit against customers who have returned multiple times, helping you understand how much of your customer base is made up of first-time visitors versus repeat visitors.
Trinkgeld: Frequent visitors can be targeted with loyalty rewards, while campaigns or coupons can encourage first-time and occasional visitors to return.
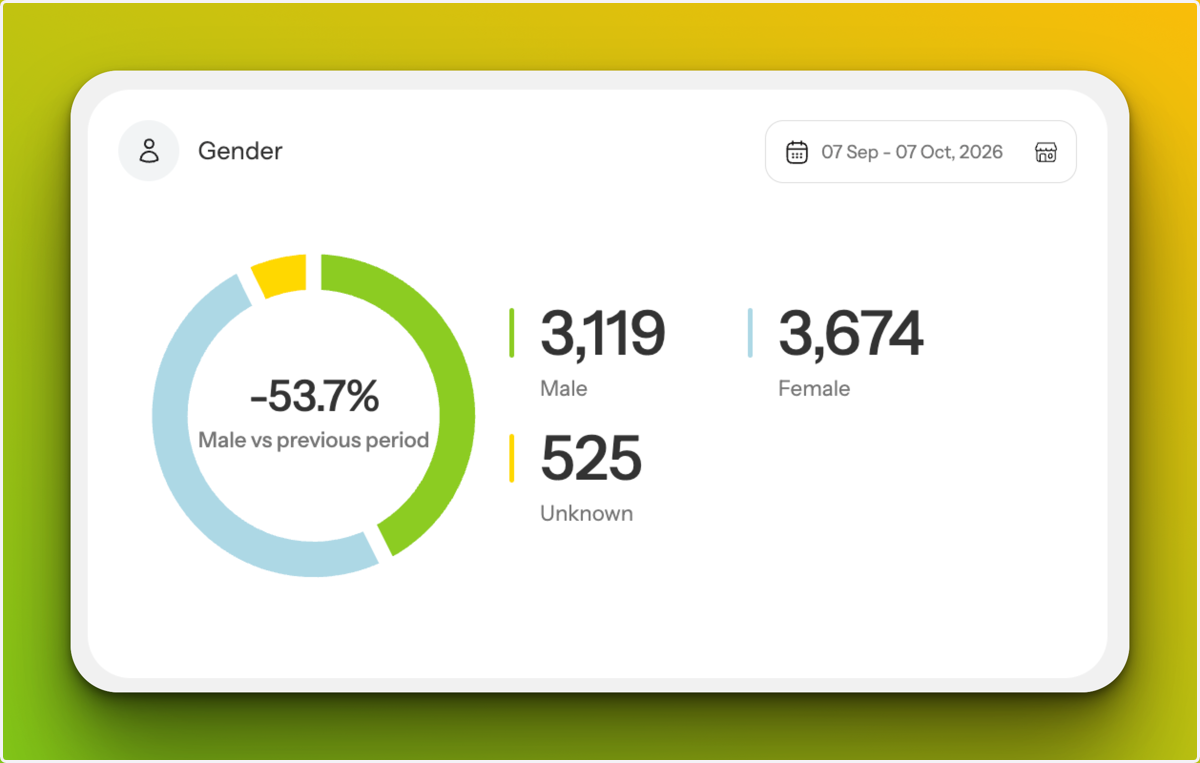
Gender
The Gender analytics show how your customers are distributed by gender, giving you a clearer view of your customer base.
Review this alongside other analytics to better understand your customer base and support more relevant campaigns and engagement.
Age
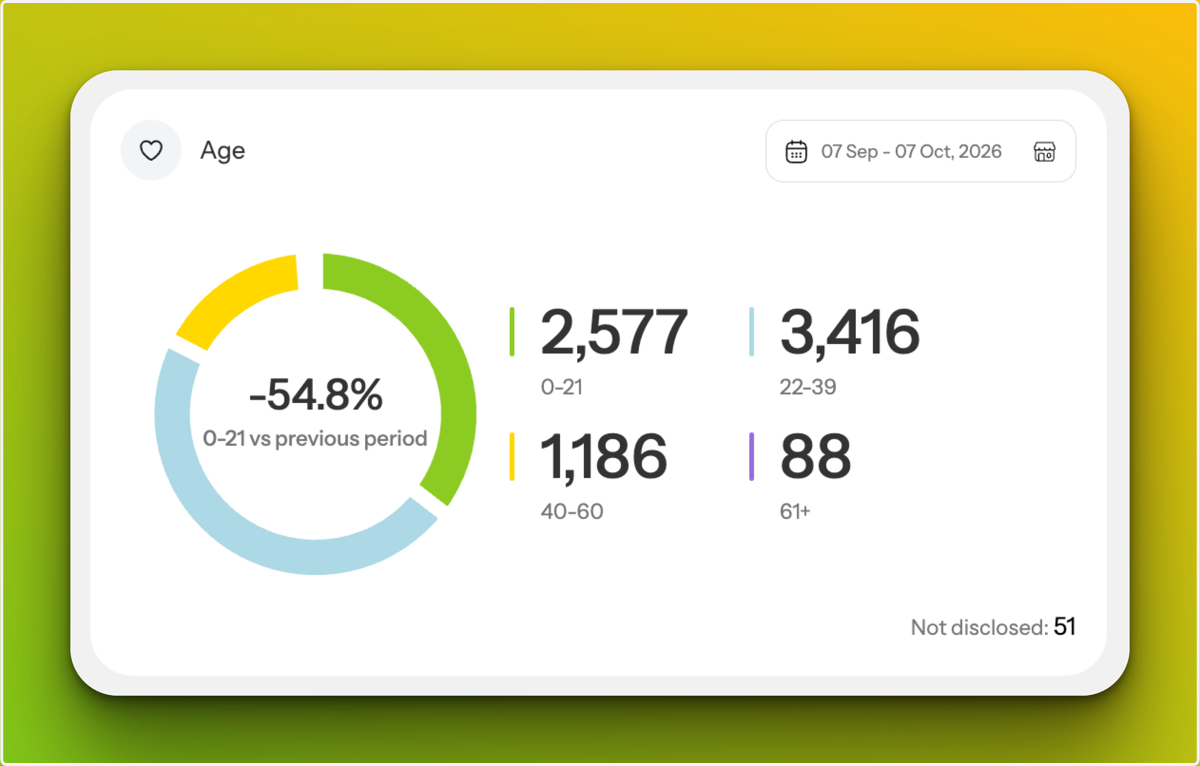
The Age analytics show how customers are distributed across different age ranges.
Not Disclosed represents customers who chose not to provide their age when this information is optional.
Visitor Type
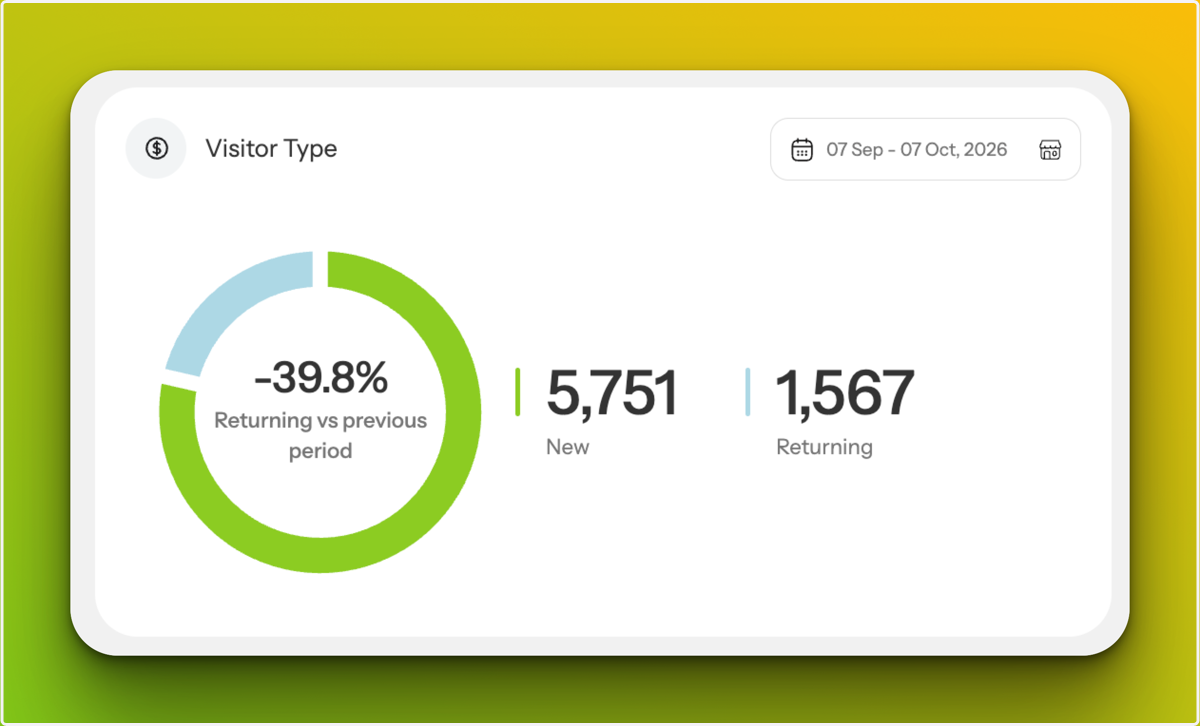
The Visitor Type analytics show how many customers are new and how many of those customers return within the selected period.
For example, when one month is selected, Returning shows customers who first visited during that month and returned again before the month ended. This shows how many new customers were converted into returning customers.
Trinkgeld: Use loyalty programs, follow-up campaigns or return-visit coupons to encourage new customers to return.
Contact Type
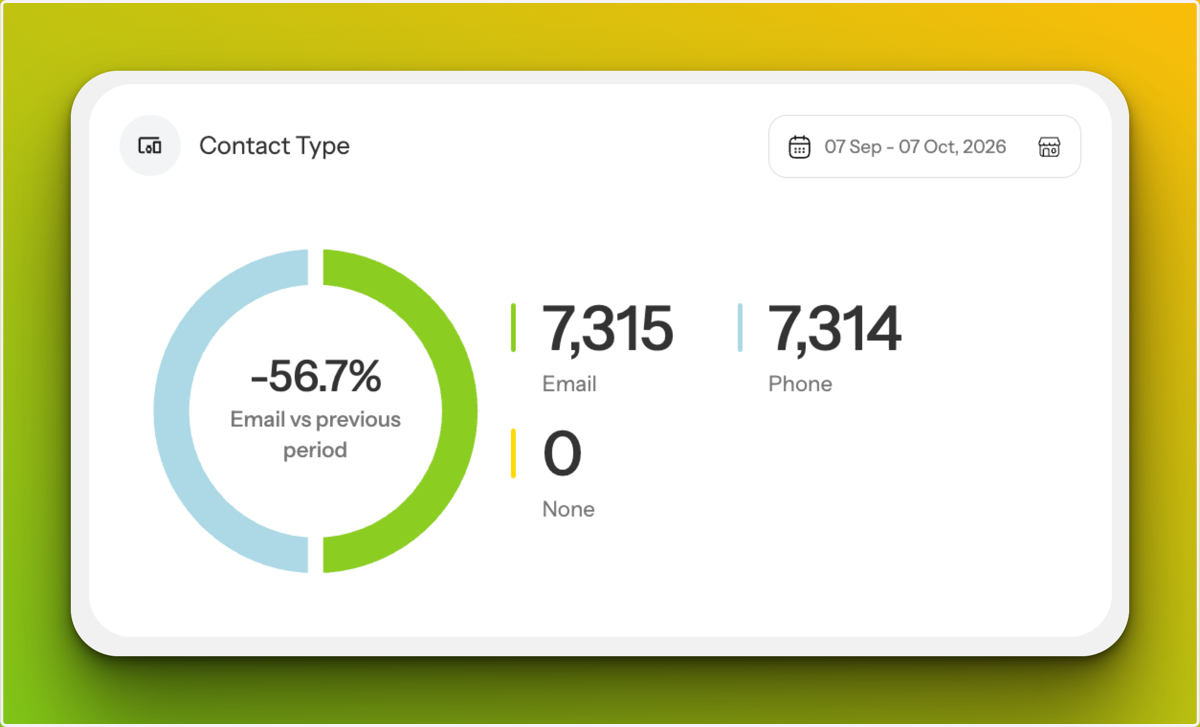
The Contact Type analytics show what contact details are available in each contact profile.
- Email – contact profiles with a usable email address.
- Phone – contact profiles with a usable phone number.
- None – contact profiles with no usable email or phone number. This may happen if the customer did not provide contact details, connected through Facebook without those details being recorded, or an email address bounced.
A contact profile can appear under both Email and Phone if both details are available.
Real-Time Users
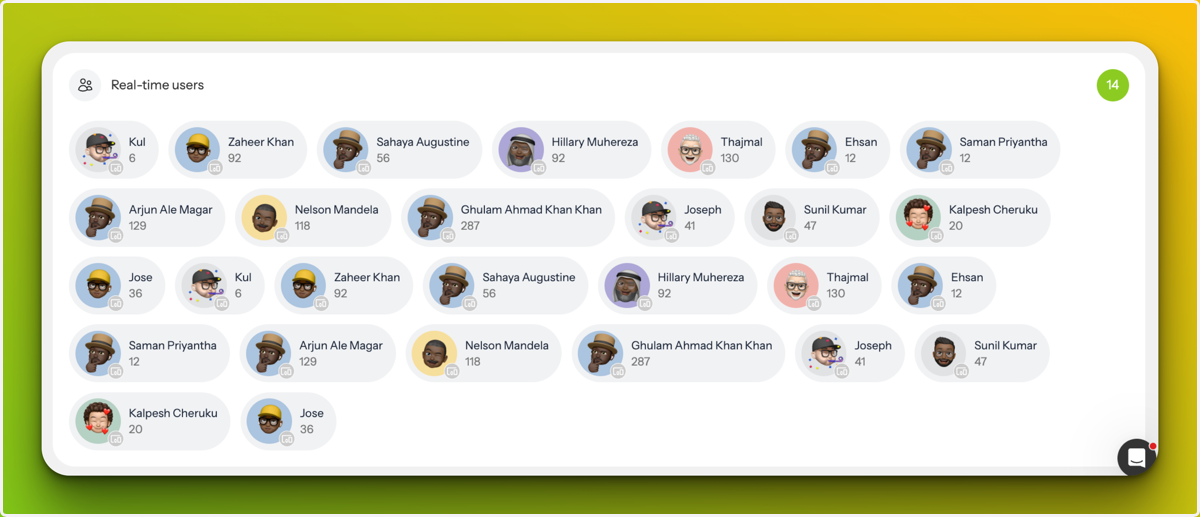
The Real-Time Users section shows customers who have connected to the venue's Wi-Fi within the last hour.
Each card displays the available contact profile details and the number of visits currently recorded for that customer.
Need Help? Use the Support Chat
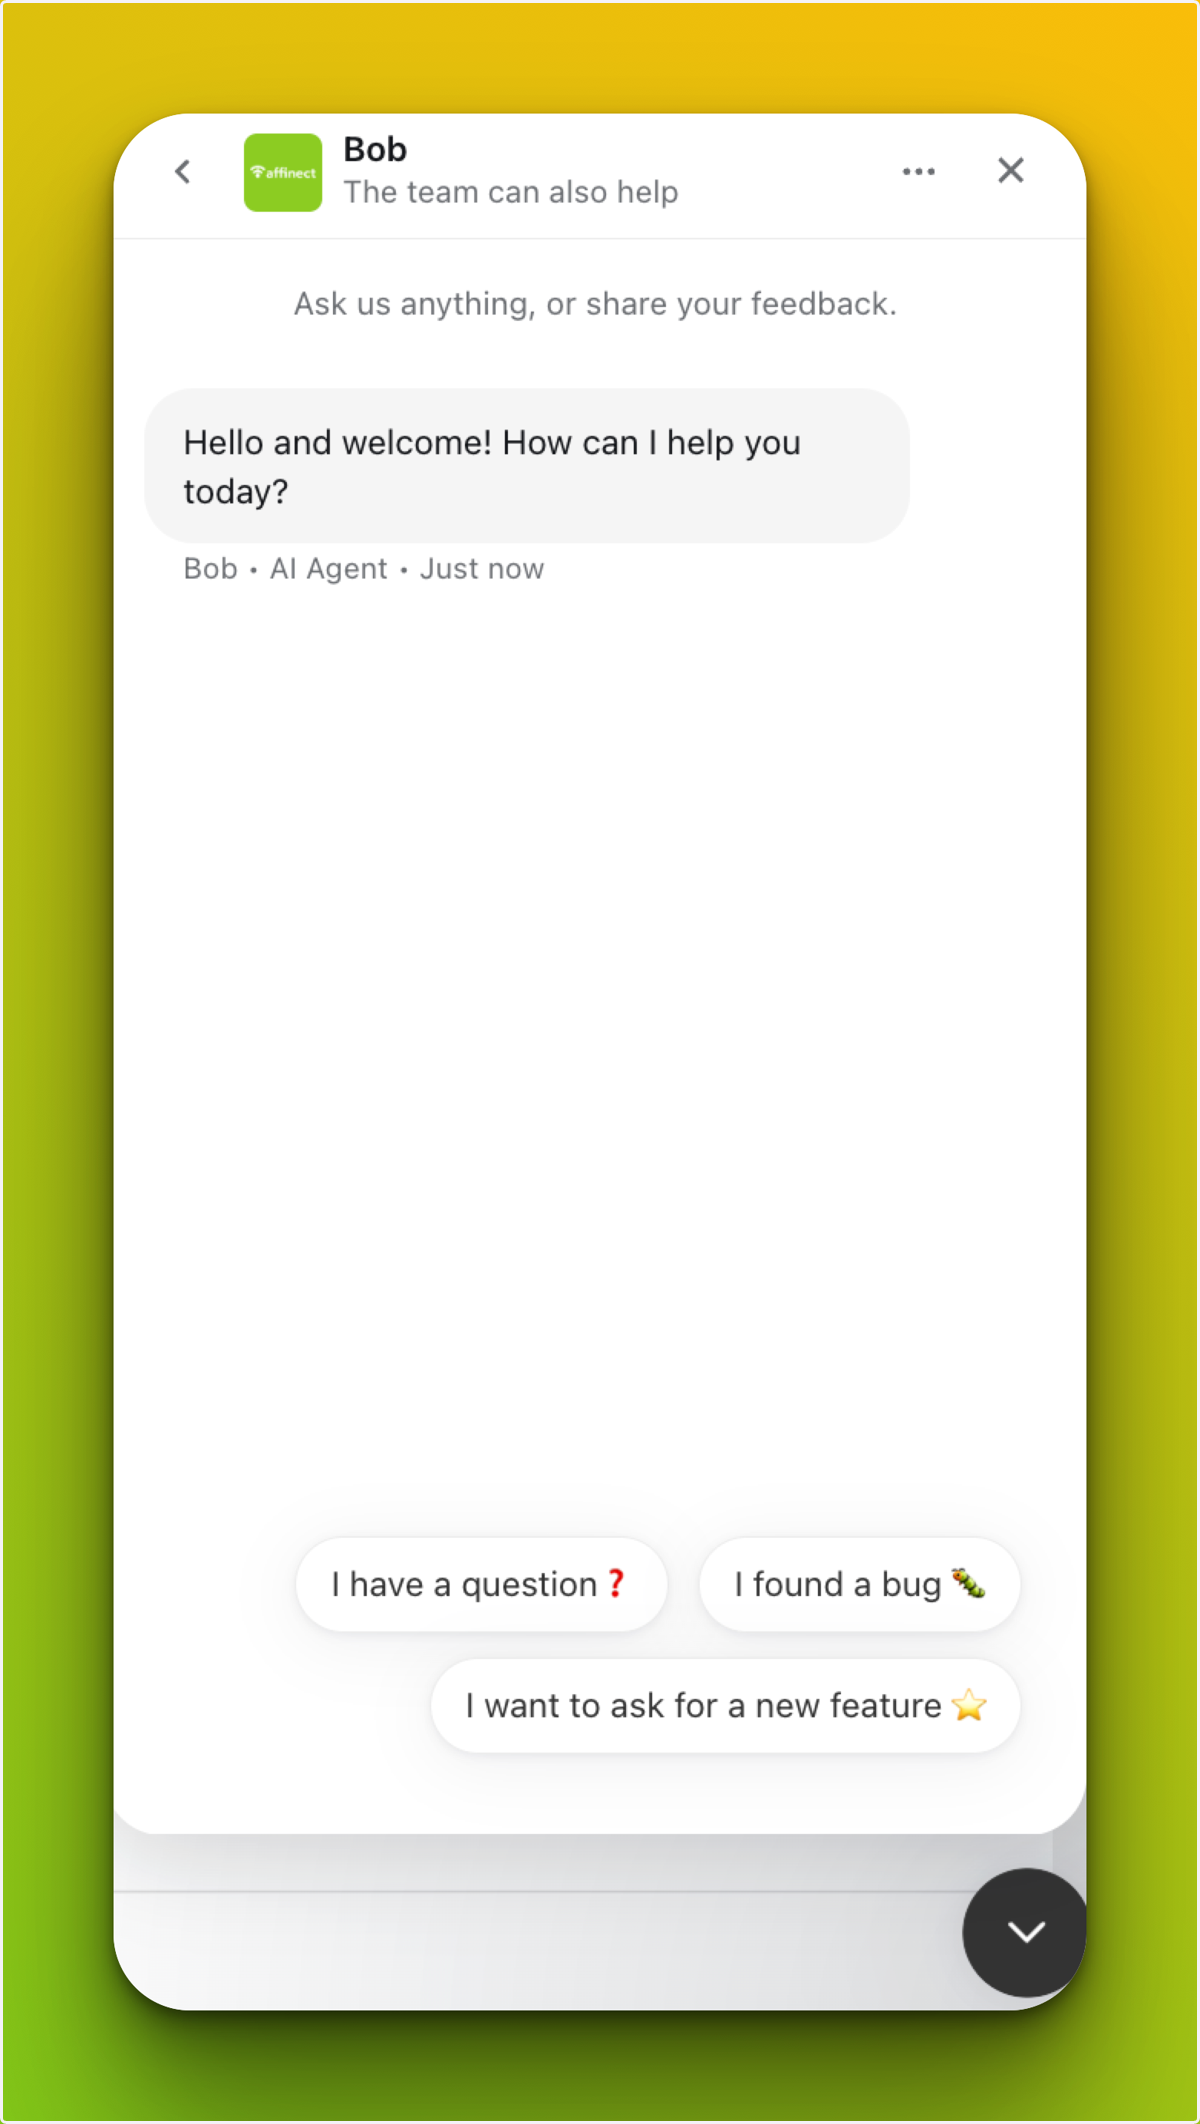
The Support Chat gives you quick access to Affinect support directly from the dashboard.
Use it whenever you need help with a feature, your analytics, or anything else within the platform.
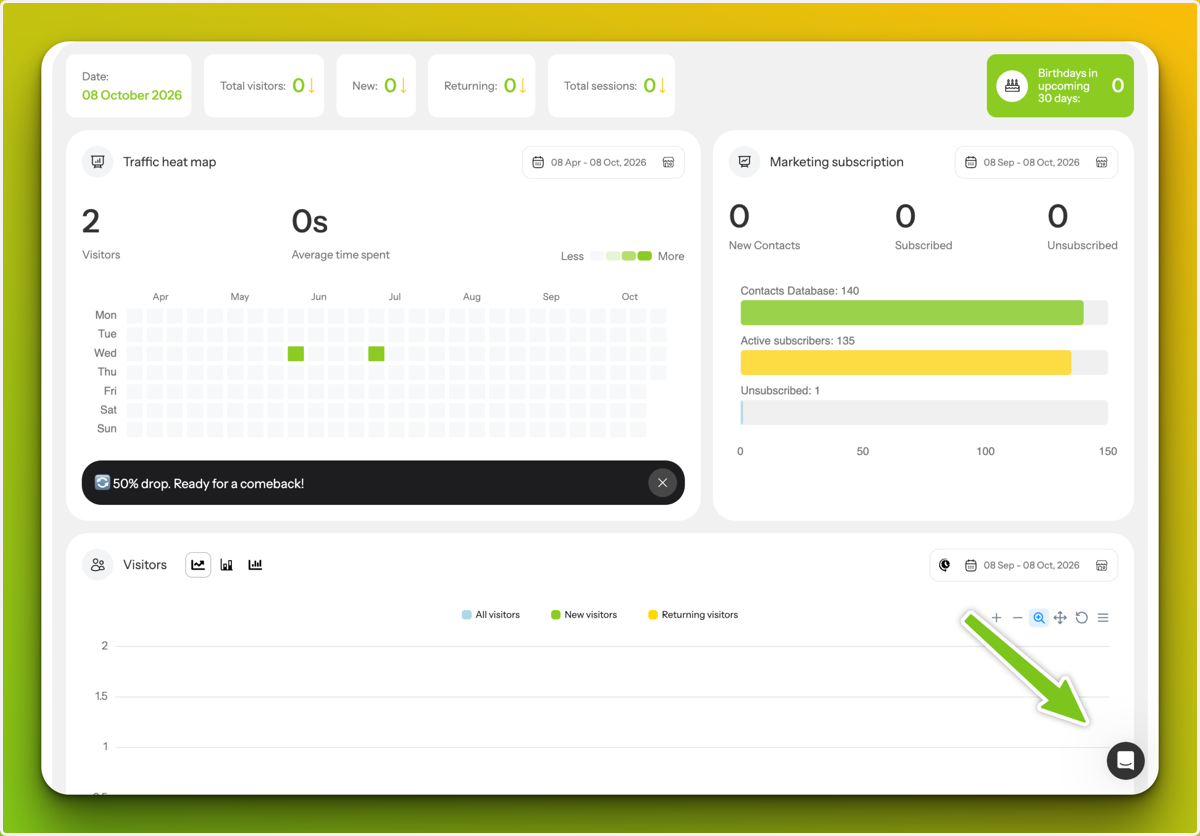
How to Use the Support Chat
From the Support Chat, you can:
- Ask a question
- Report an issue
- Request a new feature