Created
Jan 19, 2025
·
7
Steps
Verwenden der Traffic Heat Map in Affinect
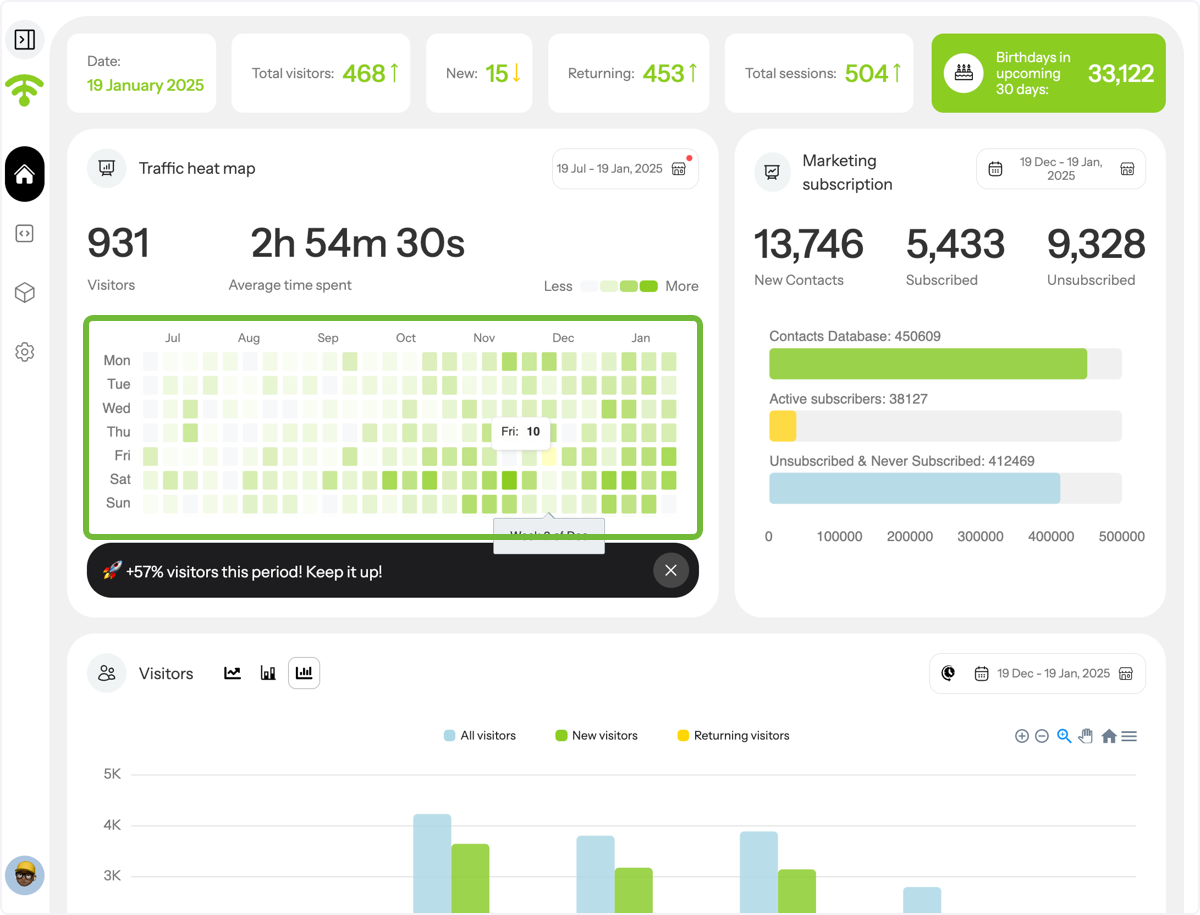
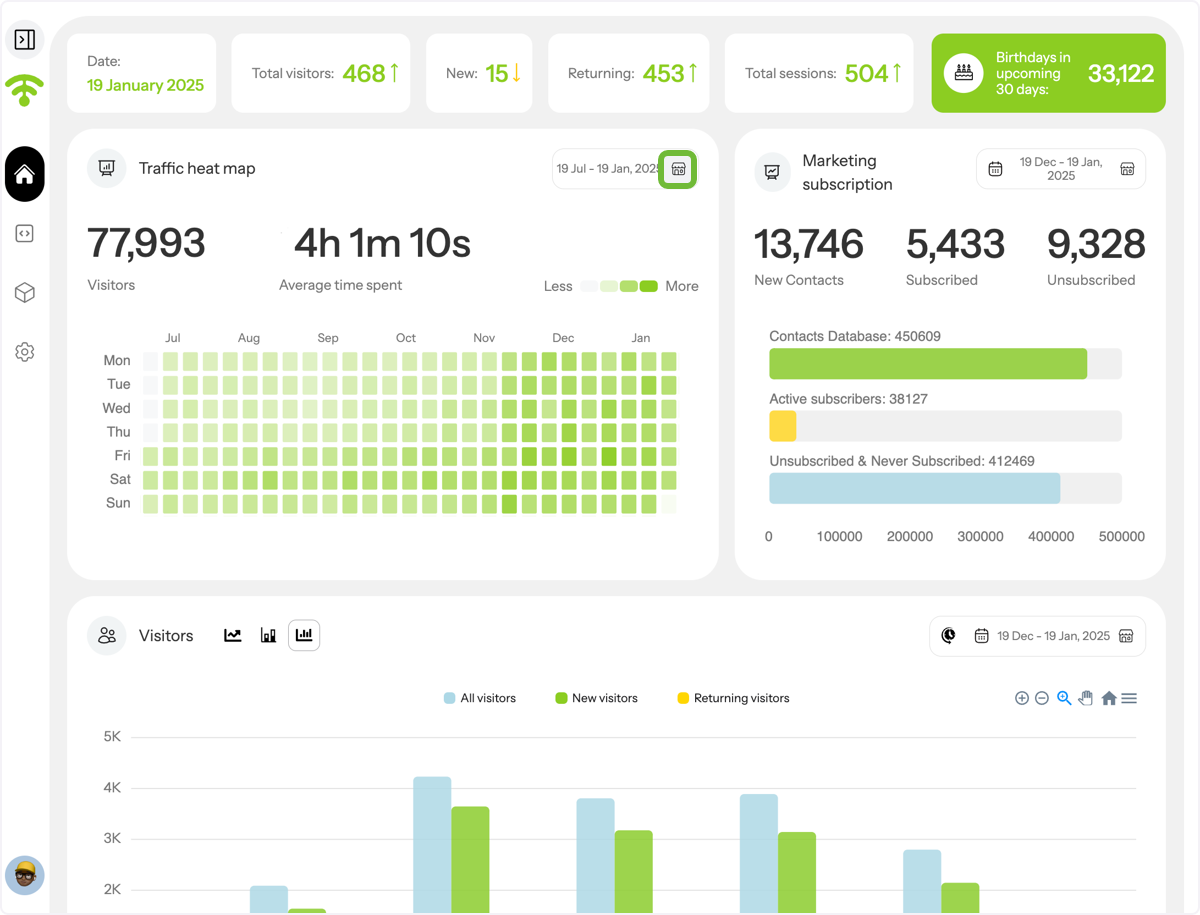
The traffic heat map provides a snapshot of visitors' activity across all venues over the last six months.
Affinect
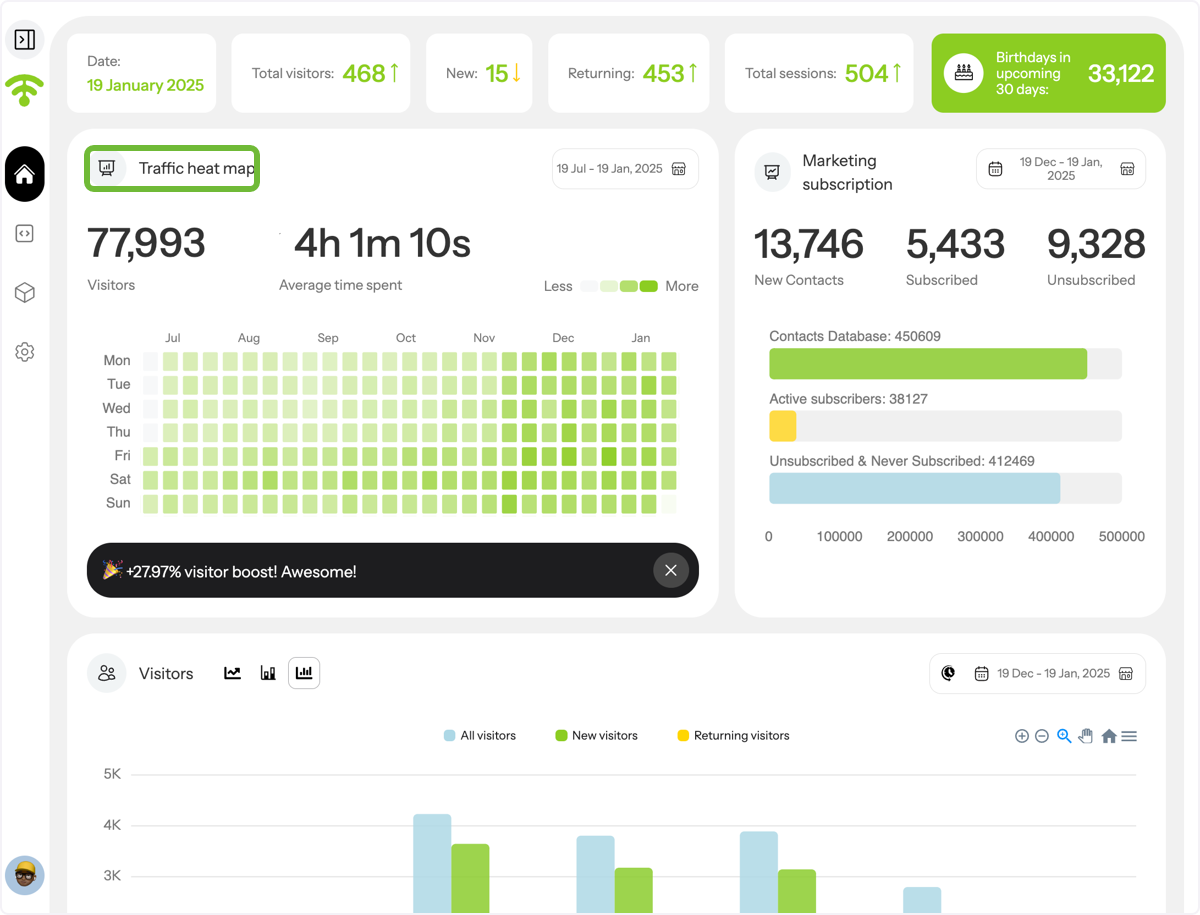
Head to the Traffic heat map section
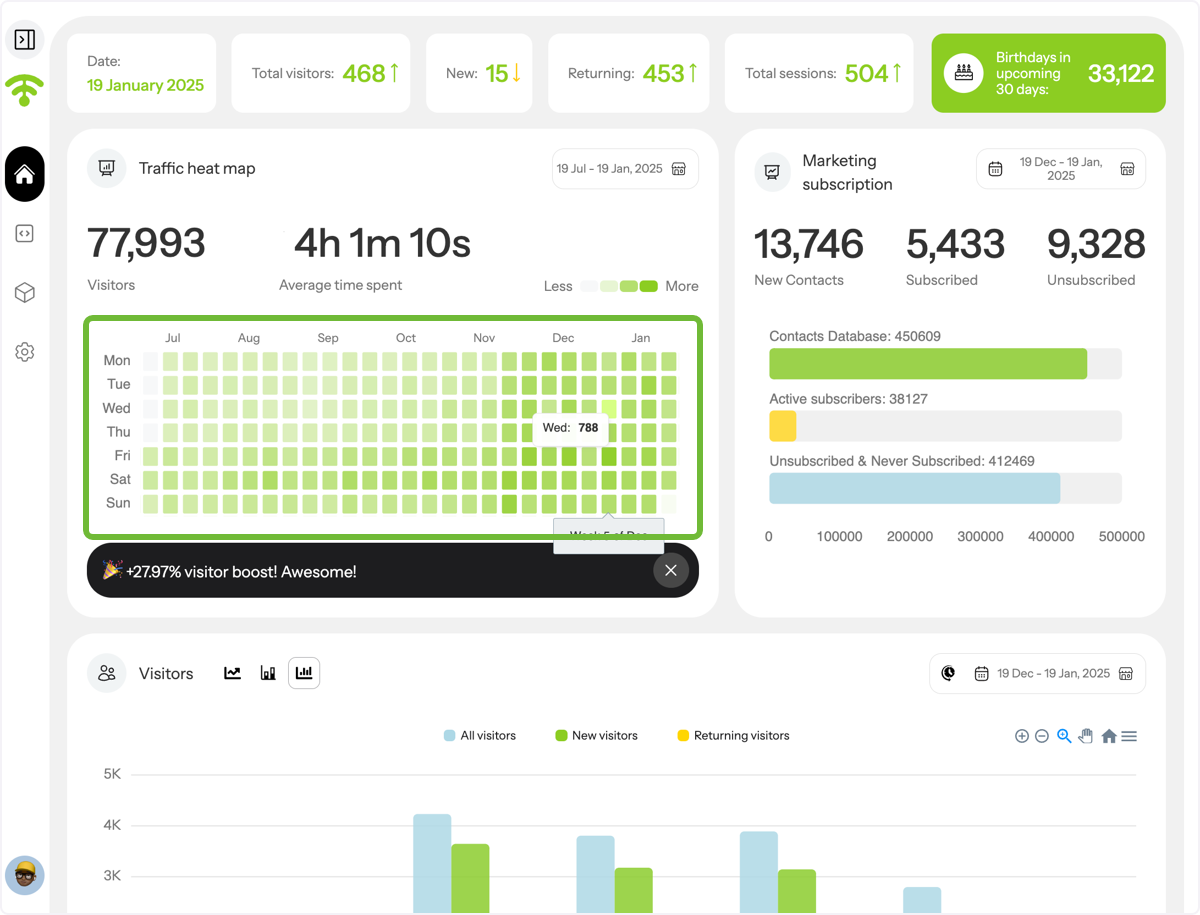
Hover over any day to see the sum of the unique visits *
\*Unique visits are when visitors log in to a venue per day, regardless of how many sessions the person has on that day in the same venue.
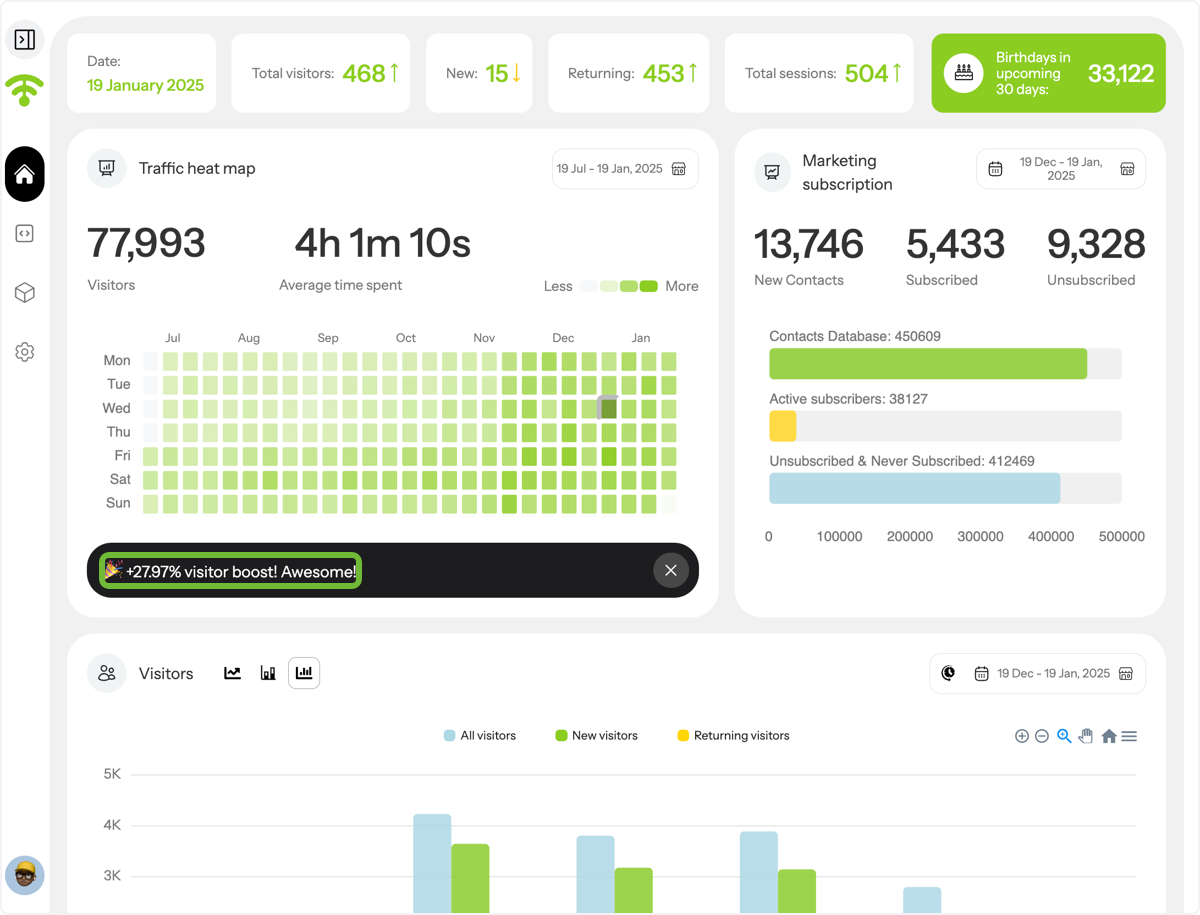
The % represents the improvement/decline of footwall vs the previous 6 months.
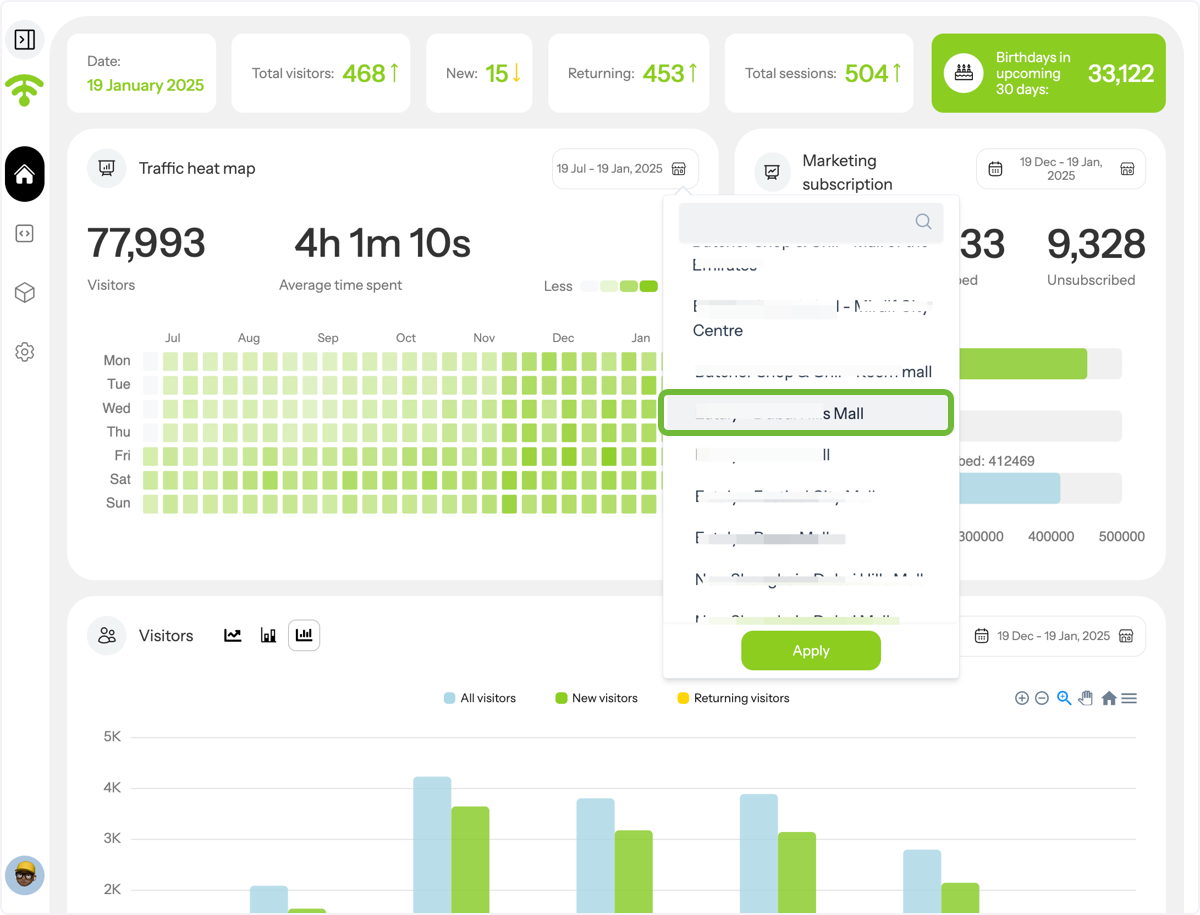
MULTIVENUE ACCOUNT: If you want to select one or multiple venues view, click on the venue icon.
Select the venue you want to view or select multiple.
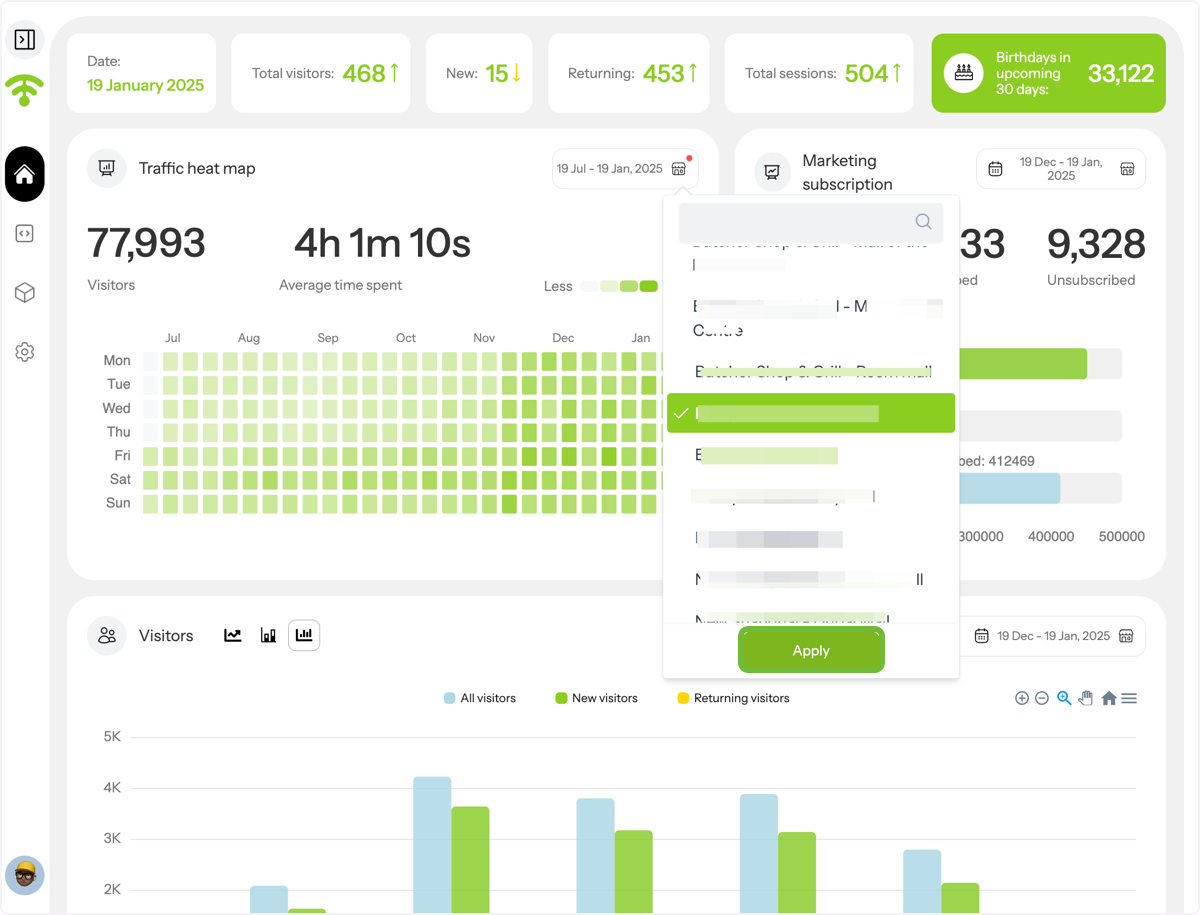
Click on Apply
Click on Mon…